
Structured Data for Art and Play
"1950s architectural theorists are just overly expressive programmers".
I once read that "mathematics is just language", that math is man's attempt to simplify our abstract, kaleidoscope world into manageable triangles and squares, ordered neatly onto a sheet of paper, in LaTex, or as symbols in the sand.
I've been obsessed with the use of structured data for the past several years. At Arbor, we helped helped brands reach real customers instead of bots by abstracting the concept of a "person" into a graph of internet cookies and device IDs. Representing cookies as nodes, we tied them together with login events (hashed email addresses) to form cylic and incomplete graphs that could be better used for advertising.
e.g. Instead of inferring two users out of two devices, we represented an individual as a graph comprised of two edges.
sha256(irajfko@gmail.com) – cookieID123
sha256(irajfko@gmail.com) – idfa123
And then at Audiograph, where we enabled podcast listeners to share clips of their favorite podcast with their friends, first by transcribing lengthy audio files to text, and then assigning timestamps to each word or group of words ("phrases") to properly allow someone to share text tied to audio.
"Some people have pretty good show notes. so maybe you'll get lucky and you can find it, right. but if everyone had transcripts, and it was all searchable, it'd be a game changer."
{
    speaker_id: 1
    word: "some"
    start_timestamp: 1204s
    end_timestamp: 1206s
},
{
    speaker_id: 1
    word: "people"
    start_timestamp: 1206s
    end_timestamp: 1208s
},
Most recently, I've found myself explaining coffees to customers paralyzed by the overwhelming number of foreign names, origins, and varieties on the coffee shelf.
Conversations with these customers follow a familiar pattern:
- How are you thinking of brewing this coffee? (Espresso people want toastier coffees whereas pour over drinkers typically want fruiter, floral coffees).
- Do you have a preference for a specific origin or processing method? (Washed coffees are mild and sweet, but coffees involving maceration/fermentation can taste very acidic or barnyard-like. Does the customer have an established flavor profile and where do they lie on the spectrum?)
Ultimately, the objective is to understand how the individual drinker lands on the scales of sweetness, acidity, and bitterness, and secondarily, novelty or another variable like aftertaste or body.
After a while, different customers fall into different "shapes", with vertices that point more toward acidity (fruit) or more toward bitterness (chocolate).
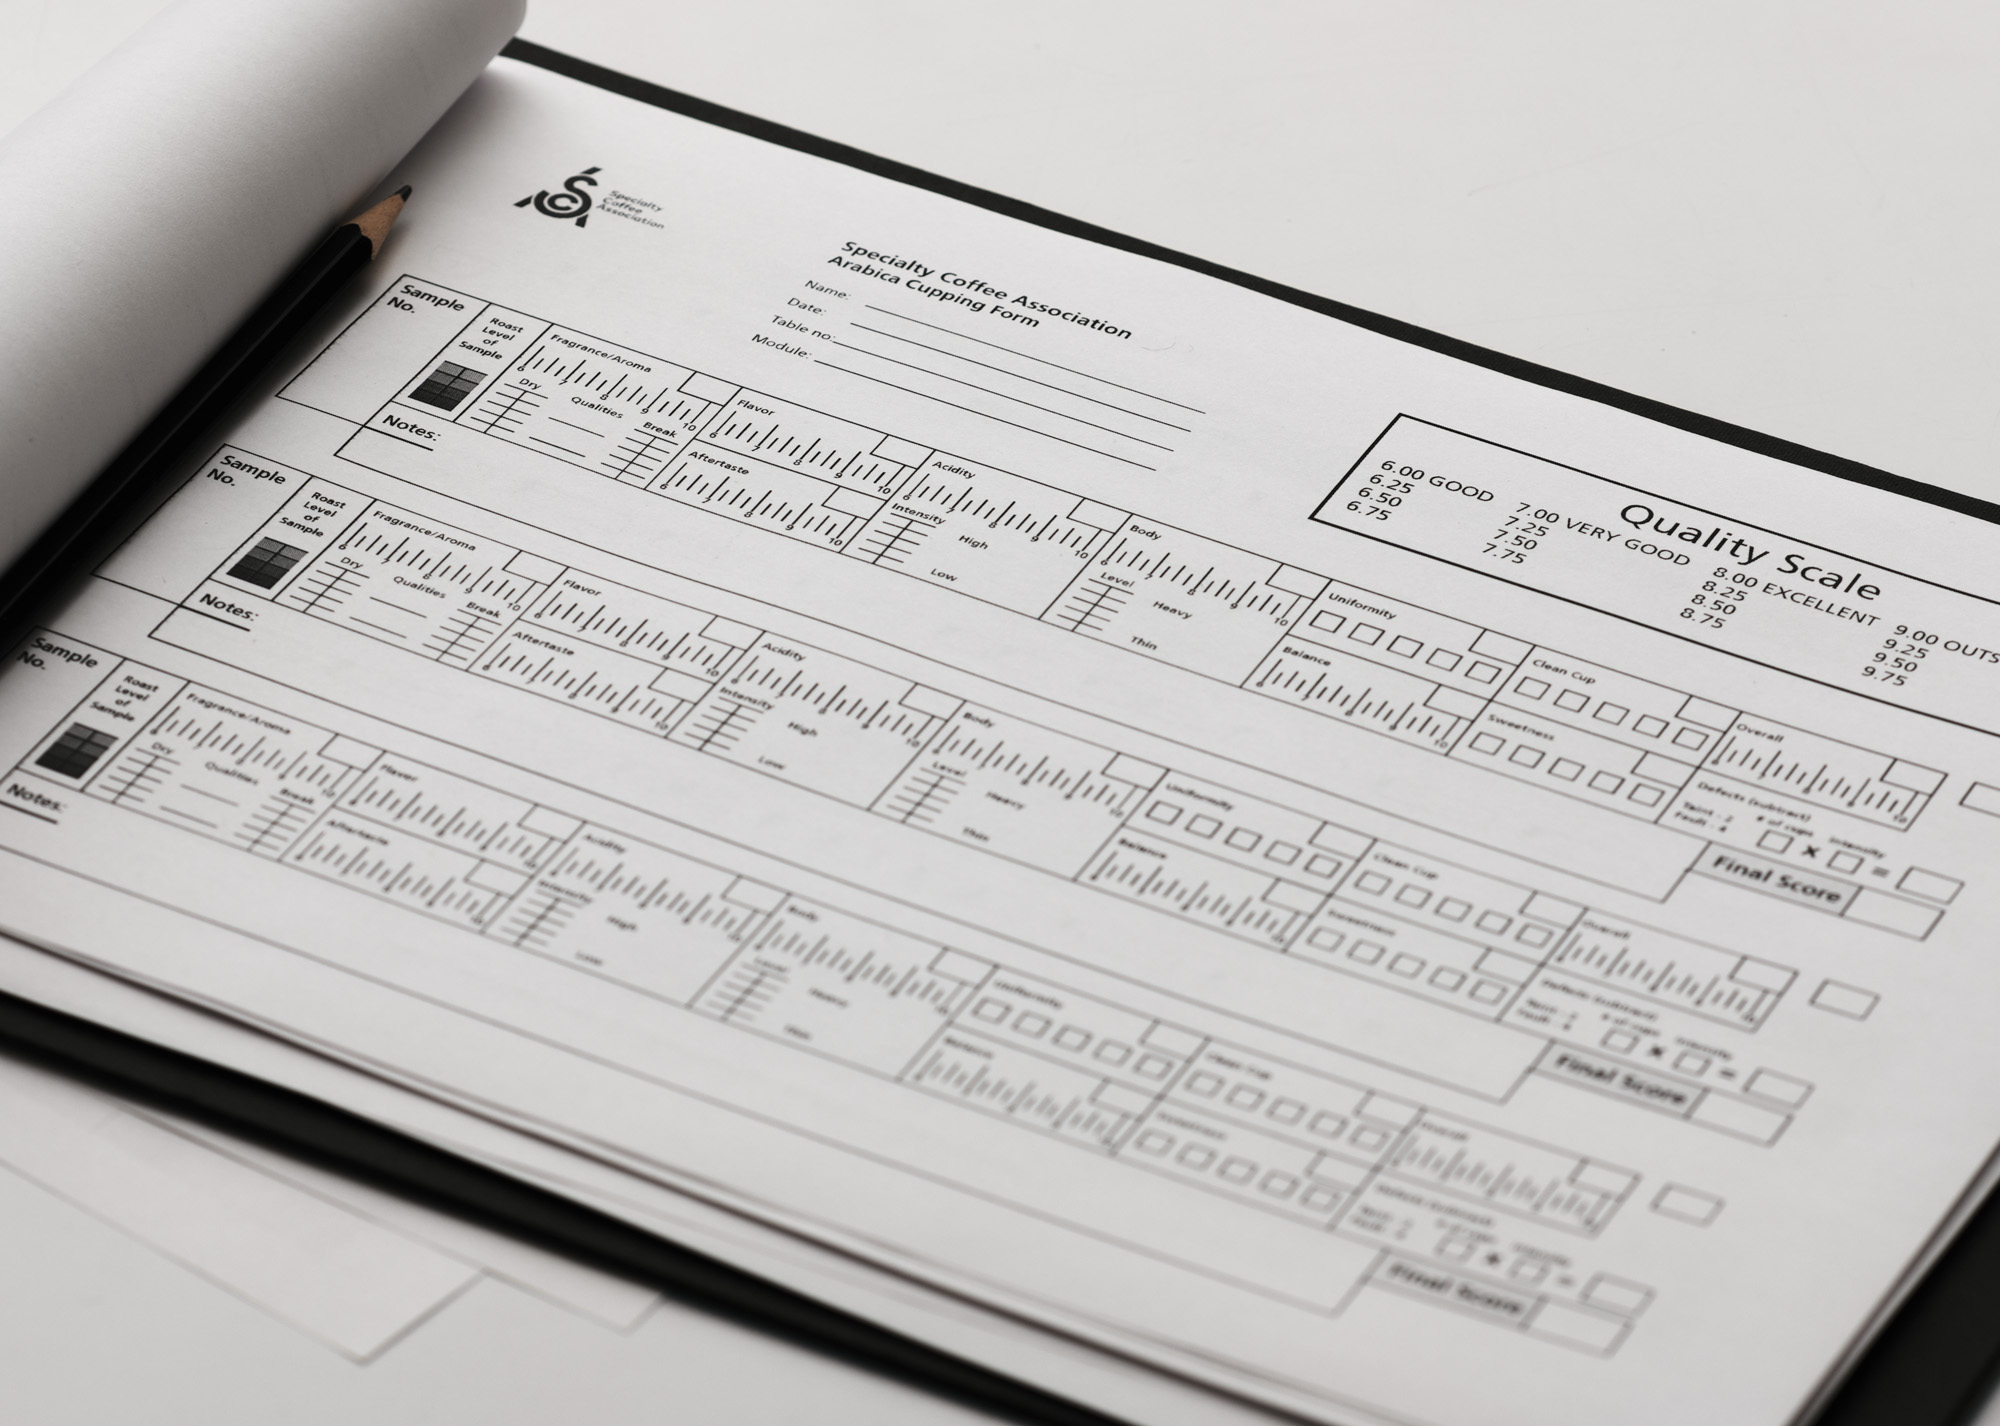
Coffee tasting ("grading") is surprisingly, fairly scientific.
Today, exporters and importers have entire lists of coffees with generally agreed upon coffee notes, all tucked away on spreadsheets not obviously available to the customer. Most roasters choose from these catalogues and attempt to express or construct flavor profiles to meet customer demand.
Resultantly, a successful roaster is often actually a successful marketer, because they understand what their customer drinks better than the customer themselves.
As data person and a product manager, I can't help but feel that there should be a marketplace for matching coffee drinkers with their favorite coffees. I often think of Rich Barton's idea of "turning the monitor around" and empowering customers with tools formerly exclusive to agents on the other side of the table.
What if we could express customer preferences in terms of simple, quantifiable data structures and then matchmake sellers and buyers accordingly? What if we could build a recommendation engine that would relieve roasters from the job of marketing, so that they're able to focus on the craft of roasting and expressing terroir? What if we stopped using transparency as a marketing buzzword, and actually provided farmers with a clear picture of what customer demand actually looks like?
With the rise of SaaS products like Segment and Snowflake, data is often thought of in terms of pipelines and warehouses. We often think of data as plumbing and code, but we forget how fascinating it can be to represent something as nuanced as "flavor" into a product that helps people experience the richer, more abstract qualities of life.
For many of us, coffee is a sacred, daily ritual. What if we could make that more colorful? Perhaps by fully understanding a few shapes, we can better create the entire kaleidoscope.