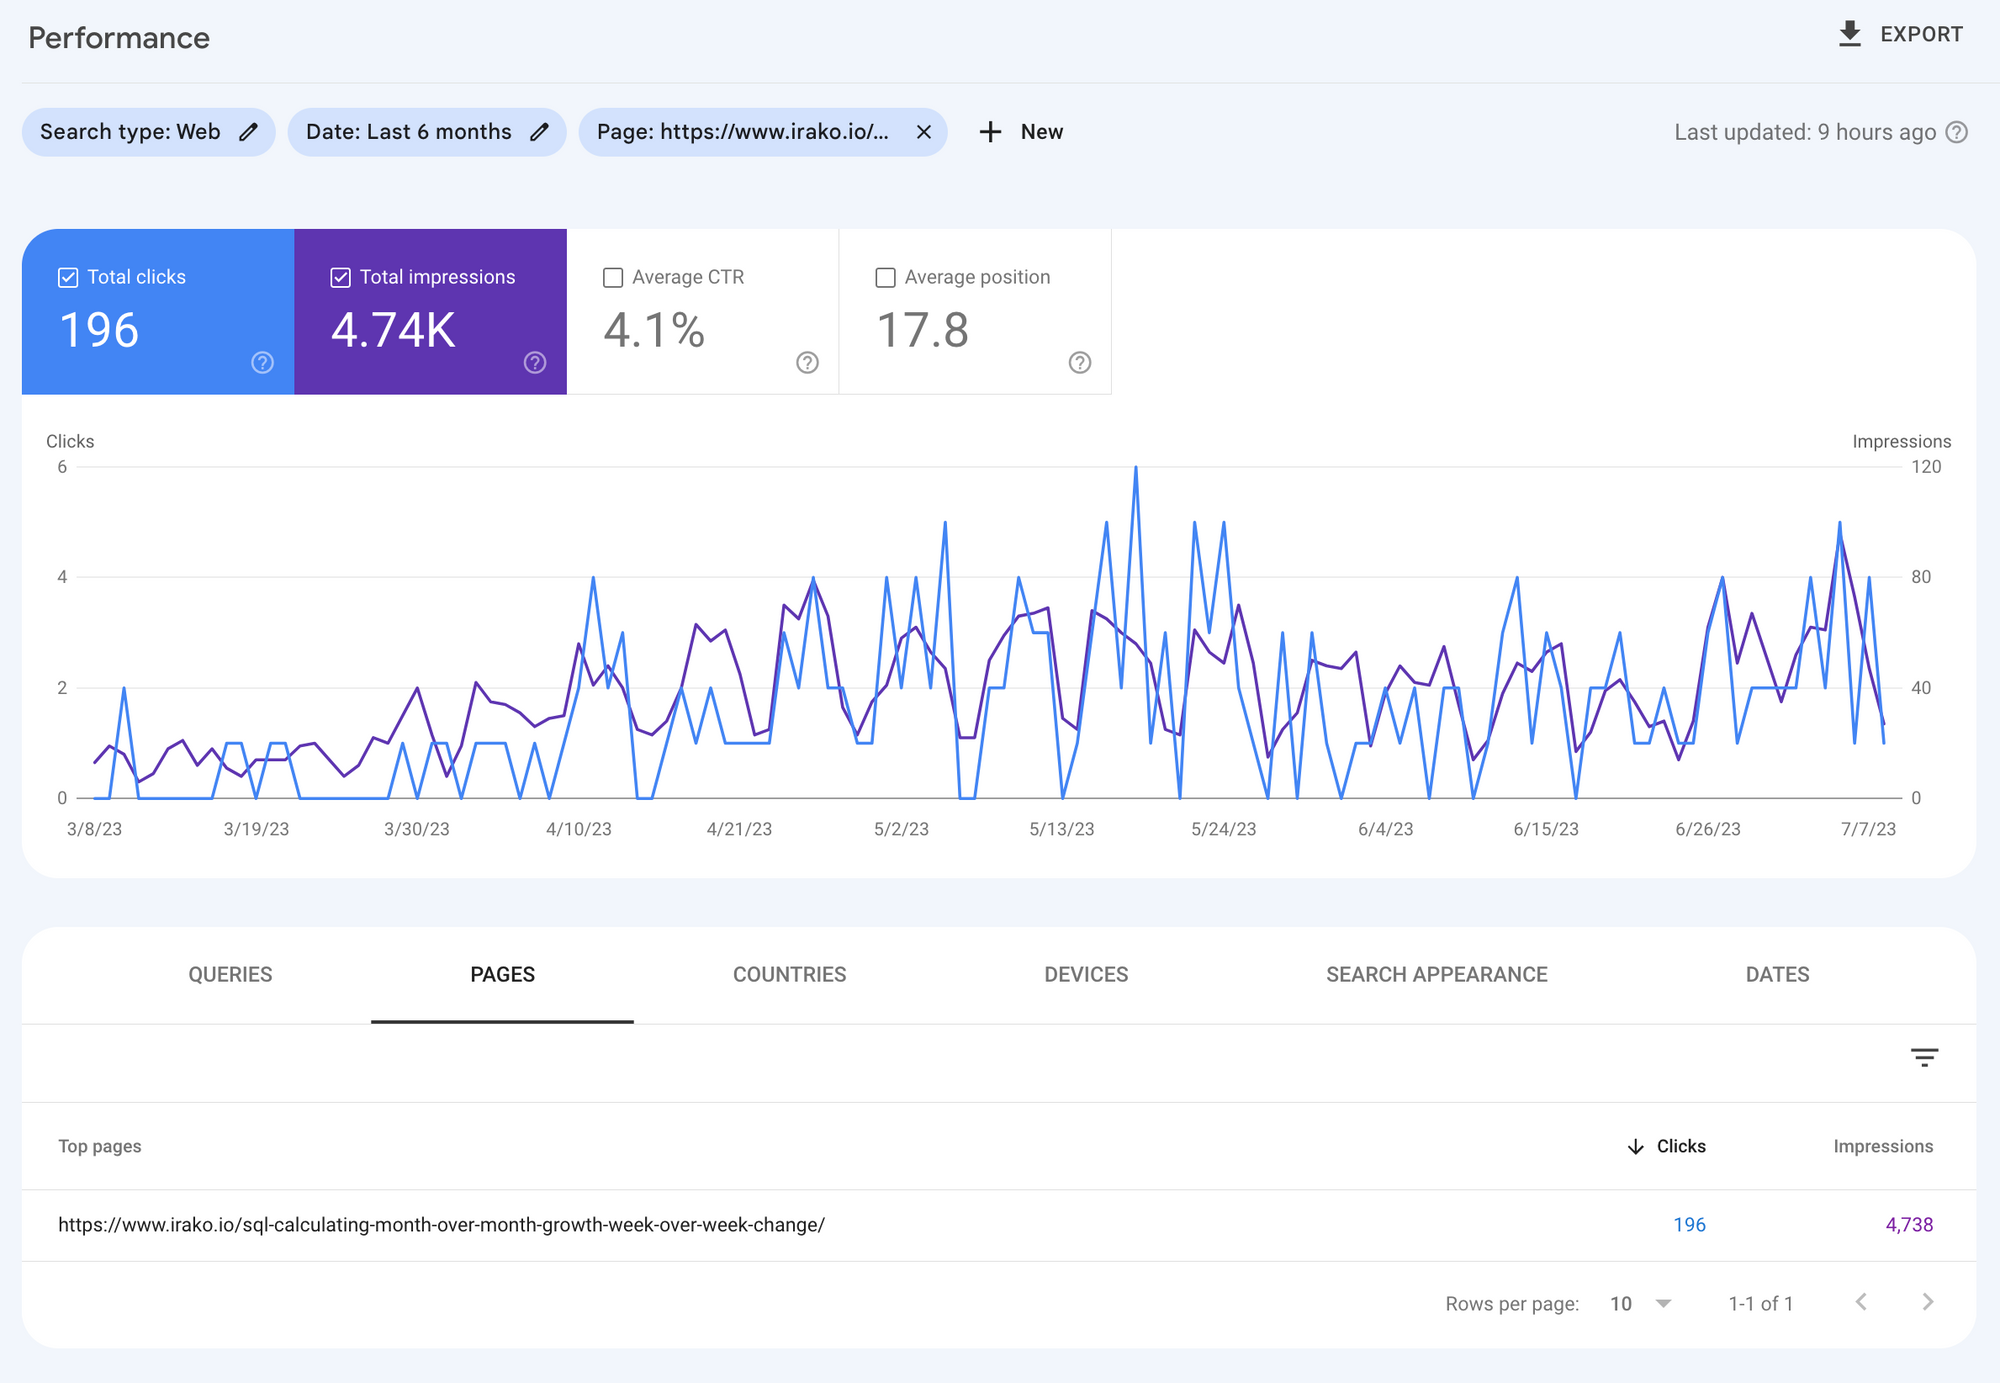
SQL: Calculating Month over Month Growth / Week over Week Change (SEO Hack)
When to use the LAG Function in SQL?
When you need to generate a report comparing data across time periods in SQL, you should use a LAG function.
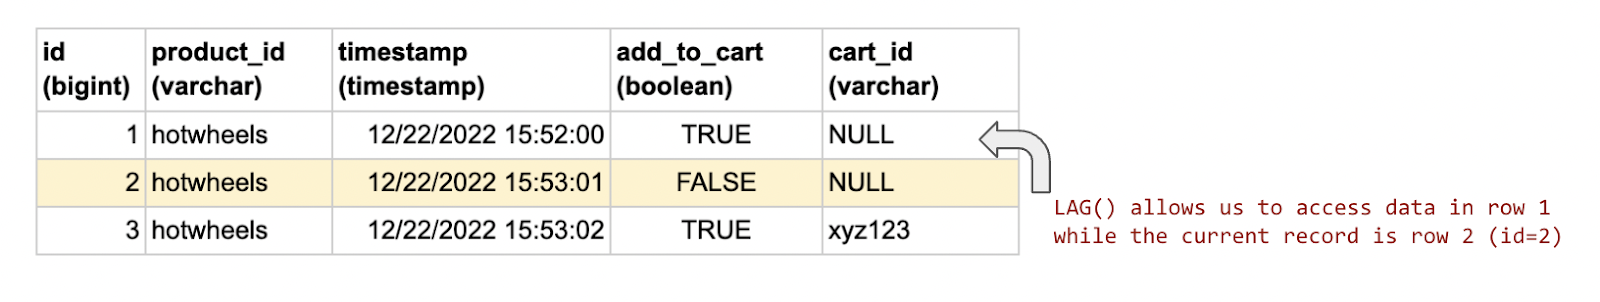
PostgreSQL’s LAG() function allows you to perform operations with the row preceding the current record. For example, LAG() allows you to look up the properties of row 1 (id = 1) when the current row is row 2 (id = 2).
LAG() functions are most useful when comparing data over time including:
- Forecasting sales or revenue given data over time
- Calculating WoW or MoM changes in purchases, site traffic, or specific user actions
- Identifying trends involving money and purchases (money supply, ERC-721 wash-sales)
LAG Function Syntax Explained
LAG is a window function. Window functions allow you to perform calculations across rows and specify which rows to apply the calculation and in what order.
LAG Functions have the following syntax:
LAG(return_value, offset [,default])
OVER (
    [PARTITION BY partition_expression, ... ]
    ORDER BY sort_expression [ASC | DESC], ...
)
return_value
This is the column or value that you are looking to return (i.e. Sales or Subscribers).
offset
The offset determines which preceding row(s) to reference when performing the calculation. Usually, this is 1 referring to the 1st preceding row.
PARTITION BY
PARTITION BY creates the "window" of rows upon which the calculation is to be performed. For example, if you're looking for MoM change per product group, the PARTITION BY clause will only compare data against rows that belong to the same product group.
A mental model for thinking about this is writing multiple subqueries where rows are filtered by product group (WHERE product group = ...). This is the window of rows upon which your calculations will be performed.
ORDER BY
ORDER BY defines how rows within the partition should be ordered. This is usually a time column like month, week, day, or timestamp.
Let's look at a practical example.
Calculating Day Over Day Growth – Example
For example, you’re the Head of Data for an e-commerce startup and you have a firehose of events representing products added and removed from cart.
events.cart_events
-- Follow along by creating a db in Supabase
CREATE TABLE cart_events (
    id bigint generated by default as identity primary key,
    product_id varchar,
    timestamp timestamp,
    add_to_cart boolean,
    cart_id varchar );
INSERT INTO cart_events (product_id, timestamp, add_to_cart, cart_id ) VALUES
    ('hotwheels', '12-20-2022 10:52:00', TRUE, NULL),
    ('hotwheels', '12-20-2022 12:52:00', TRUE, NULL),
    ('hotwheels', '12-21-2022 00:52:00', TRUE, NULL),
    ('hotwheels', '12-21-2022 01:22:00', TRUE, NULL),
    ('hotwheels', '12-22-2022 15:52:00', TRUE, NULL),
    ('hotwheels', '12-22-2022 15:53:01', FALSE, NULL),
    ('hotwheels', '12-22-2022 15:53:02', TRUE, 'xyz123'),
    ('barbie', '12-22-2022 15:54:24', TRUE, 'xyz123'),
    ('barbie', '12-22-2022 15:54:35', TRUE, NULL),
    ('barbie', '12-22-2022 15:55:15', FALSE, 'xyz456'),
    ('barbie', '12-22-2022 15:55:16', FALSE, 'xyz123');
The add_to_cart boolean represents whether the item was added (TRUE) or removed (FALSE) from the cart. No event is recorded for other actions in the cart.
The cart_id column has data when the cart is a known identity (e.g. when the user is logged in, or when the site has a first party cookie on the user’s browser).
Using a LAG() function, you can compare the net number of times a product is added to cart, across all carts, by day, as well as calculate the change over time (today - yesterday / yesterday). For example, if 5 new barbies were added to cart yesterday, and 10 were added today, the daily rate of change for barbies is +100% = (10 - 5) / 5 *100%.
To represent data from two time frames in two columns:
SELECT day, product_id,
    net_add_to_cart,
    LAG(net_add_to_cart, 1) OVER ( PARTITION BY product_id ORDER BY day)
    AS yesterday_add_to_cart
FROM
    ( SELECT DATE_TRUNC('day', timestamp) AS day, product_id,
    SUM( CASE
    WHEN add_to_cart IS TRUE THEN 1.0
    WHEN add_to_cart IS FALSE THEN -1.0
    ELSE 0
    END ) AS net_add_to_cart
    FROM cart_events
    GROUP BY 1, 2 ) daily_cart_events
    GROUP BY 1, 2, net_add_to_cart

Calculate day over day change
WITH cte_lagged_cart AS (
    SELECT day, product_id,
    net_add_to_cart,
    LAG(net_add_to_cart, 1) OVER ( PARTITION BY product_id ORDER BY day)
    AS yesterday_add_to_cart
    FROM
    ( SELECT DATE_TRUNC('day', timestamp) AS day, product_id,
        SUM( CASE
        WHEN add_to_cart IS TRUE THEN 1.0
        WHEN add_to_cart IS FALSE THEN -1.0
        ELSE 0
        END ) AS net_add_to_cart
        FROM cart_events
        GROUP BY 1, 2 ) daily_cart_events
    GROUP BY 1, 2, net_add_to_cart )

SELECT day, product_id,
( net_add_to_cart - yesterday_add_to_cart ) / yesterday_add_to_cart AS daily_change
FROM cte_lagged_cart
Next Steps: Generating Dummy Data
What happens when there’s missing data for a particular time frame? Perhaps there was an outage on the checkout page or a bug in the add_to_cart function. Or perhaps there simply wasn’t much user activity for a particular product for that day.
Because the LAG() function references the row immediately preceding the selected row, it’s not as effective when there are gaps in the data.
One approach to solving this problem is to exclude data that are not within a consecutive timeframe, using a WHERE clause. For example, if the current row is Month 12, and the preceding row is Month 10, exclude the rows from the final output. This approach works when you only care about data from Months n and Months n+1, but it reduces the analysis to dates where you have complete data.
The recommended approach is to generate dummy data for data that’s missing. That is, instead of having no data at all, generate rows where the counting metric (num sales, num subscribers) is zero.
We’ll explore this idea in SQL at a later time.
Mar, 2023 – This was an experiment in how to write content for SEO.